Jul 22, 2026
Territorial data collection: how to transform scattered sources into operational decisions?

Between different business files (Excel), public databases, geographical data, sensors, and tools used by teams, organizations have multiple, scattered, and heterogeneous data formats. Their main difficulty lies in finding, connecting, and exploiting them together.
The collection of territorial and environmental data is highly complex today. It constitutes the first link in any management system. It makes it possible to:
monitor environmental impacts related to water, energy, climate, waste, and mobility, as well as the associated consumption and production;
understand the vulnerabilities of a site;
compare different development scenarios;
prioritize investments.
But collecting does not mean simply accumulating more and more information. A structured collection approach must allow for retrieving truly useful data, verifying its quality, and placing it within the context of its use cases.
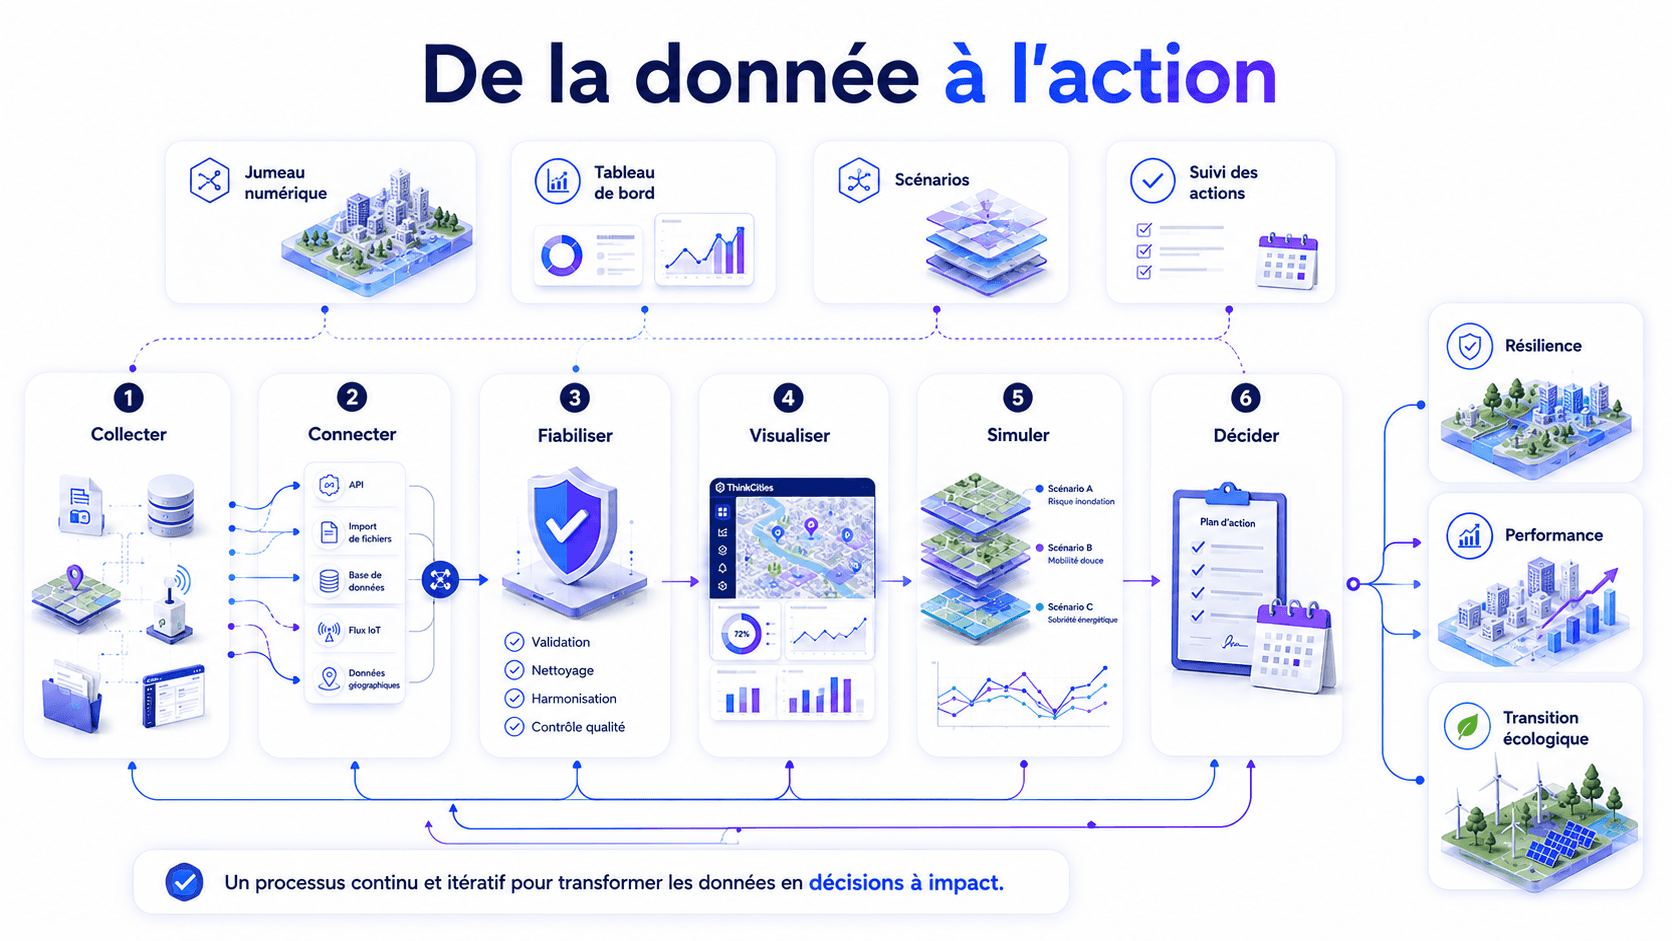
With ThinkCities®, its digital twin and territorial management solution, UrbanThink organizes this entire value chain: collect, connect, integrate, secure, visualize, and decide. In particular, ThinkCities® centralizes indicators related to consumption, climate risks and their prevention, as well as environmental impact assessment, in order to facilitate decision-making.
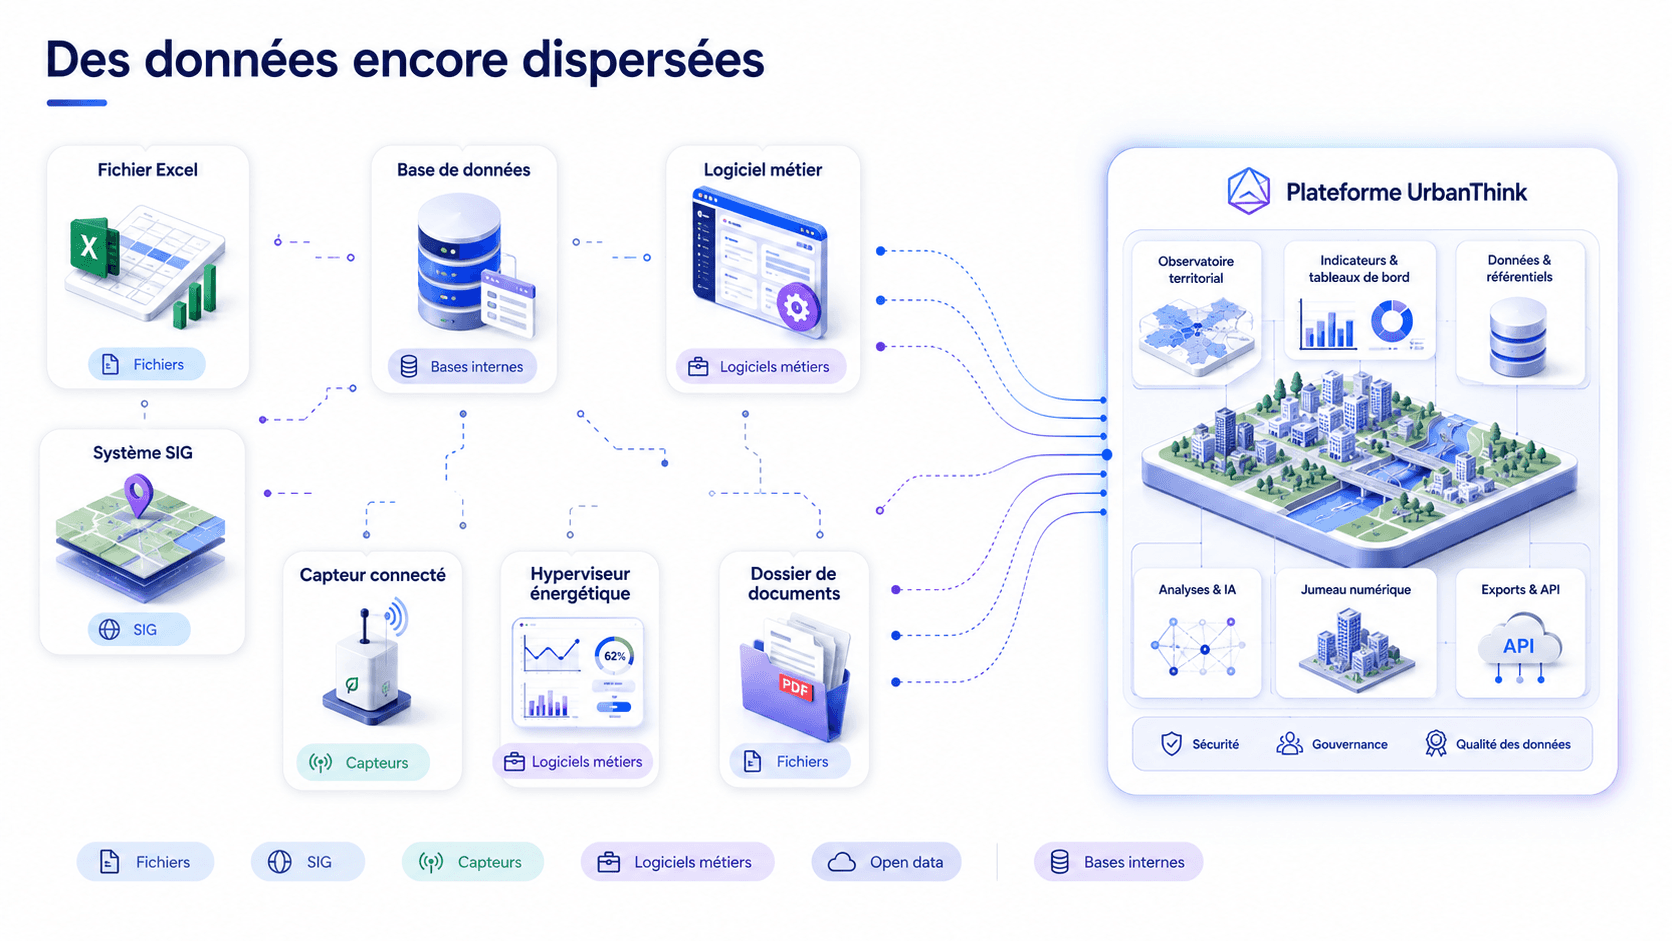
Multiple data sources still too often scattered and heterogeneous
The data required to manage a territory, real estate portfolio, or operating site is generally distributed across several departments, tools, and stakeholders.
One software program might monitor energy consumption. Another lists buildings and equipment. Internal files group together completed works, property characteristics, or regulatory objectives. To this is added public data, geographical information, and field surveys.
Each source often addresses a specific need. Taken separately, however, this information only provides a partial view of the situation.
Bringing them together, on the contrary, allows for studying the relationships between:
buildings and their consumption & production;
equipment and its usage;
networks and observed incidents;
the characteristics of the territory and its exposure to risks;
monitoring the results of implemented actions and performance evolution;
development choices and their environmental impacts.
The primary challenge is therefore not necessarily to produce new data. It consists first of identifying and better mobilizing existing data.
This approach must also be accompanied by precise governance rules. Origin, ownership, sensitivity, terms of use, and level of trust must be documented. UrbanThink presents these principles in its article dedicated to how to frame, partition, and value data entrusted to UrbanThink Platform.
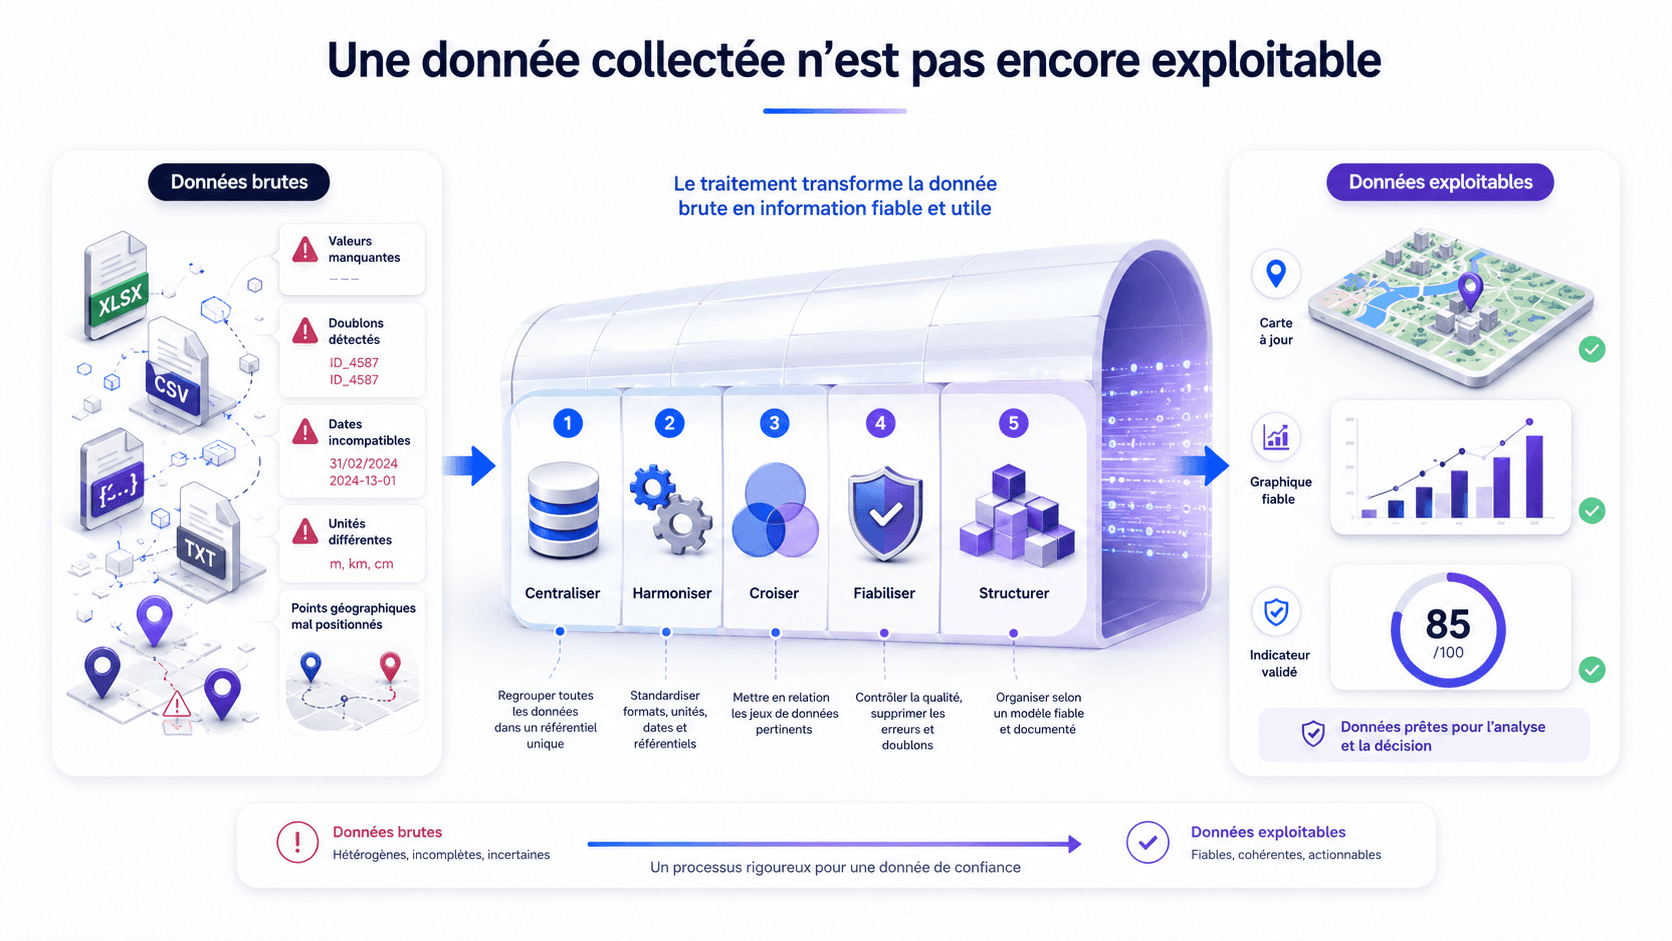
Start with the decisions to be made
An effective collection strategy does not start with the choice of a sensor, a platform, or a file format. It begins with a business question.
Which buildings consume the most? On which sites should work be prioritized? Which areas are most exposed to flooding or extreme heat? What developments would help reduce urban heat islands? Has an action actually improved the site's performance?
These questions then help define:
essential indicators;
already available data;
missing information;
the required level of accuracy;
the expected update frequency;
the associated sources and owners.
This framing phase avoids two common mistakes.
The first consists of collecting large amounts of information without having defined its use. The second is waiting to have a perfectly comprehensive database before beginning to analyze the situation.
It is often more relevant to start with a manageable scope, and then gradually enrich the system based on actual needs.
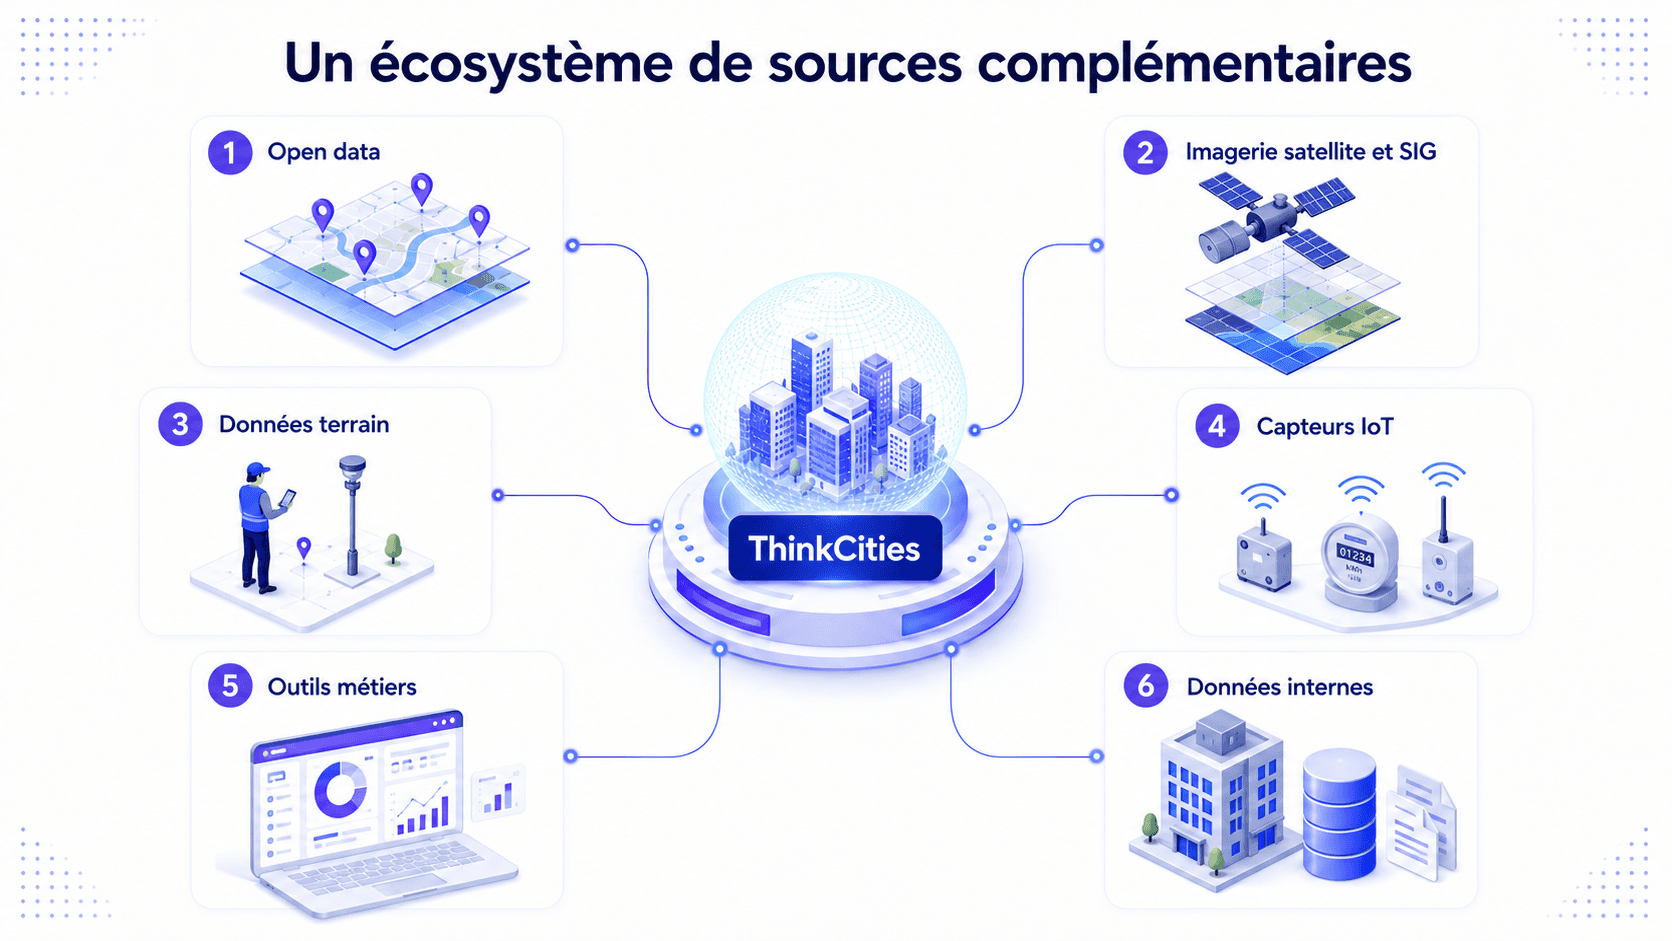
What data sources can be mobilized?
The collection of environmental and territorial data can rely on very different sources.
Public data and open data
Public platforms provide access to numerous datasets regarding energy, mobility, climate, risks, land cover, real estate, and biodiversity, among others.
data.gouv.fr is the reference French platform for downloading, sharing, and reusing public data produced by the state, local authorities, and public bodies.
These resources can enrich an analysis without having to produce all the data from scratch.
Geographical data and GIS tools
Data from a geographic information system makes it possible to locate buildings, plots, networks, equipment, natural areas, and various regulatory boundaries.
They can come from:
geographic databases;
technical plans;
cadastral databases;
aerial photographs;
satellite imagery;
topographical surveys;
business-specific cartographic layers.
The public service cartes.gouv.fr, for example, allows access to maps and data of French territory, as well as utilizing data streams and interfaces compatible with GIS and business tools.
Field-produced data
Certain information must be collected directly on the studied site:
equipment inventory;
network positioning;
meter readings;
vegetation status;
photographs of installations;
usage observations;
verification of building or space characteristics.
This data makes it possible to compare existing reference systems with reality on the ground and complete missing information.
Sensors, connected objects, and hypervisors
IoT sensors can automatically transmit data relating to water or energy consumption, temperature, humidity, air quality, or the operation of an equipment piece.
Depending on the use, data can be reported in real time or at a specified frequency.
However, real-time reporting is not always necessary. A leak alert may require frequent reporting, whereas an inventory of tree assets or cadastral data will evolve much more slowly.
Organization tools and databases
Companies and local authorities already possess a large amount of internal information:
Excel or CSV files;
property databases;
technical management software;
hypervisors;
energy monitoring tools;
financial data;
maintenance documents;
work plans;
CSR indicators;
customer or user databases;
regulatory documents.
The goal is not to systematically replace these tools, but to extract or connect the necessary information for management purposes.
Connecting sources without replacing all existing tools
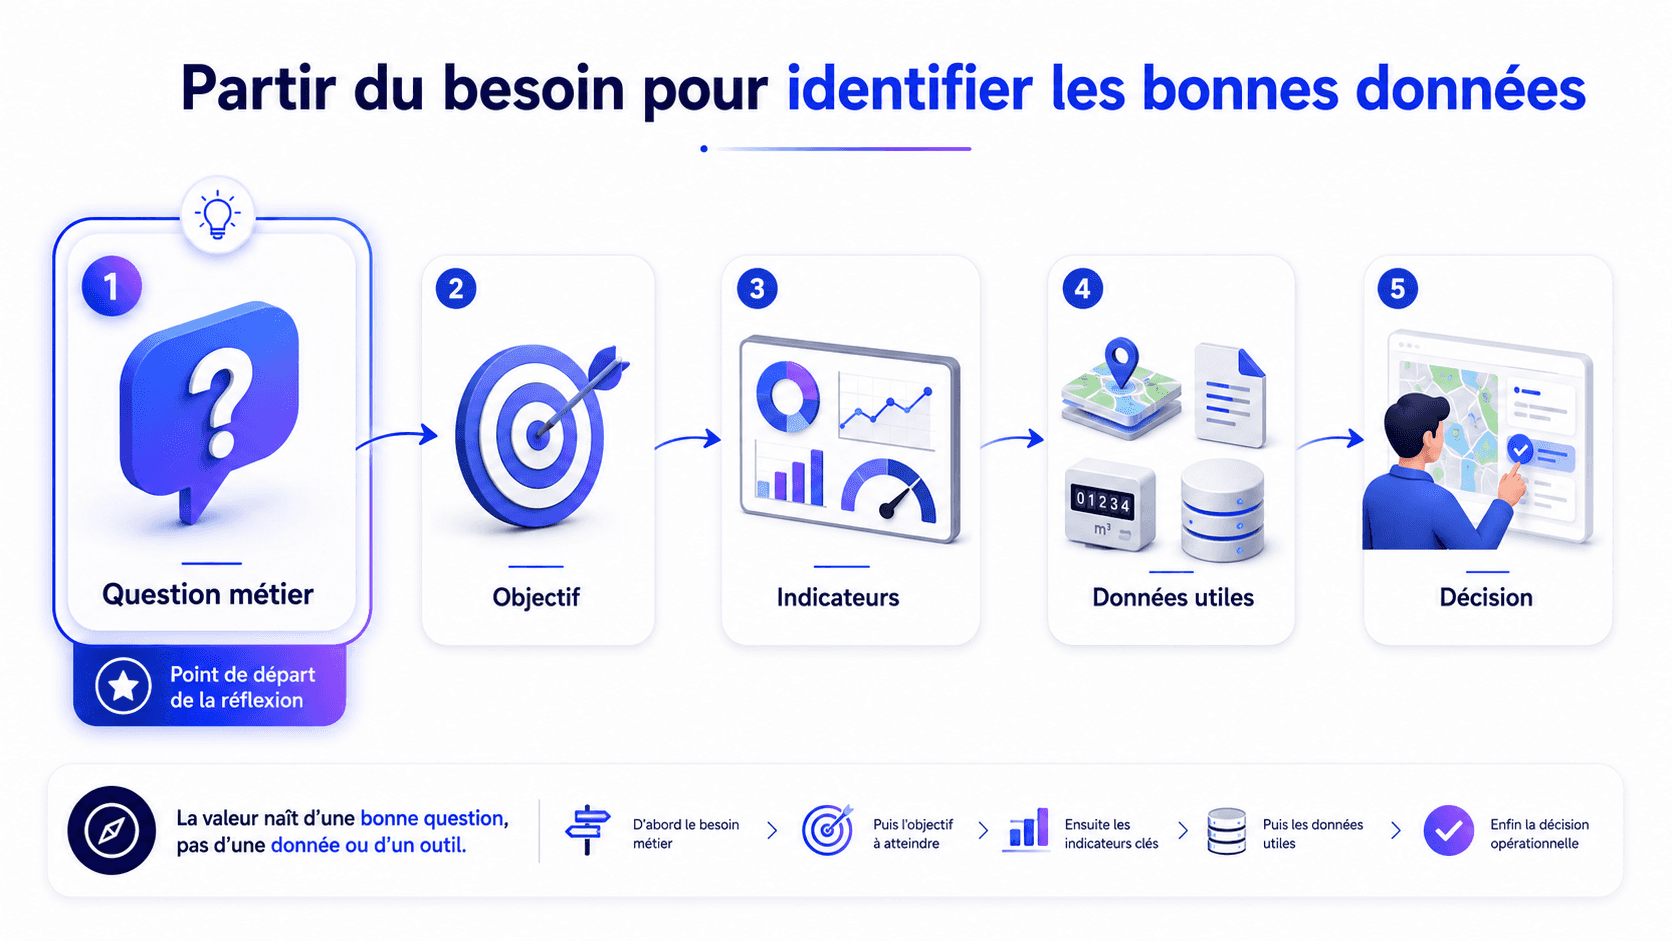
Creating a consolidated view does not always require rebuilding the entire information system.
UrbanThink can rely on several connection methods:
APIs;
file imports;
connections to business databases;
streams from IoT sensors;
real-time reporting;
geographic services and data.
A property manager can thus keep their asset management software and energy hypervisor. A local authority can continue to use its GIS tools. A multi-site company can maintain its operational applications while gathering useful indicators in a common environment.
This logic makes it possible to preserve investments already made and team habits.
It aligns with the principle of a digital portal designed to centralize uses without adding complexity. Such a portal does not necessarily aim to eliminate all existing applications: it can federate them, structure access, and offer a more coherent entry point.
Collected data is not yet usable data
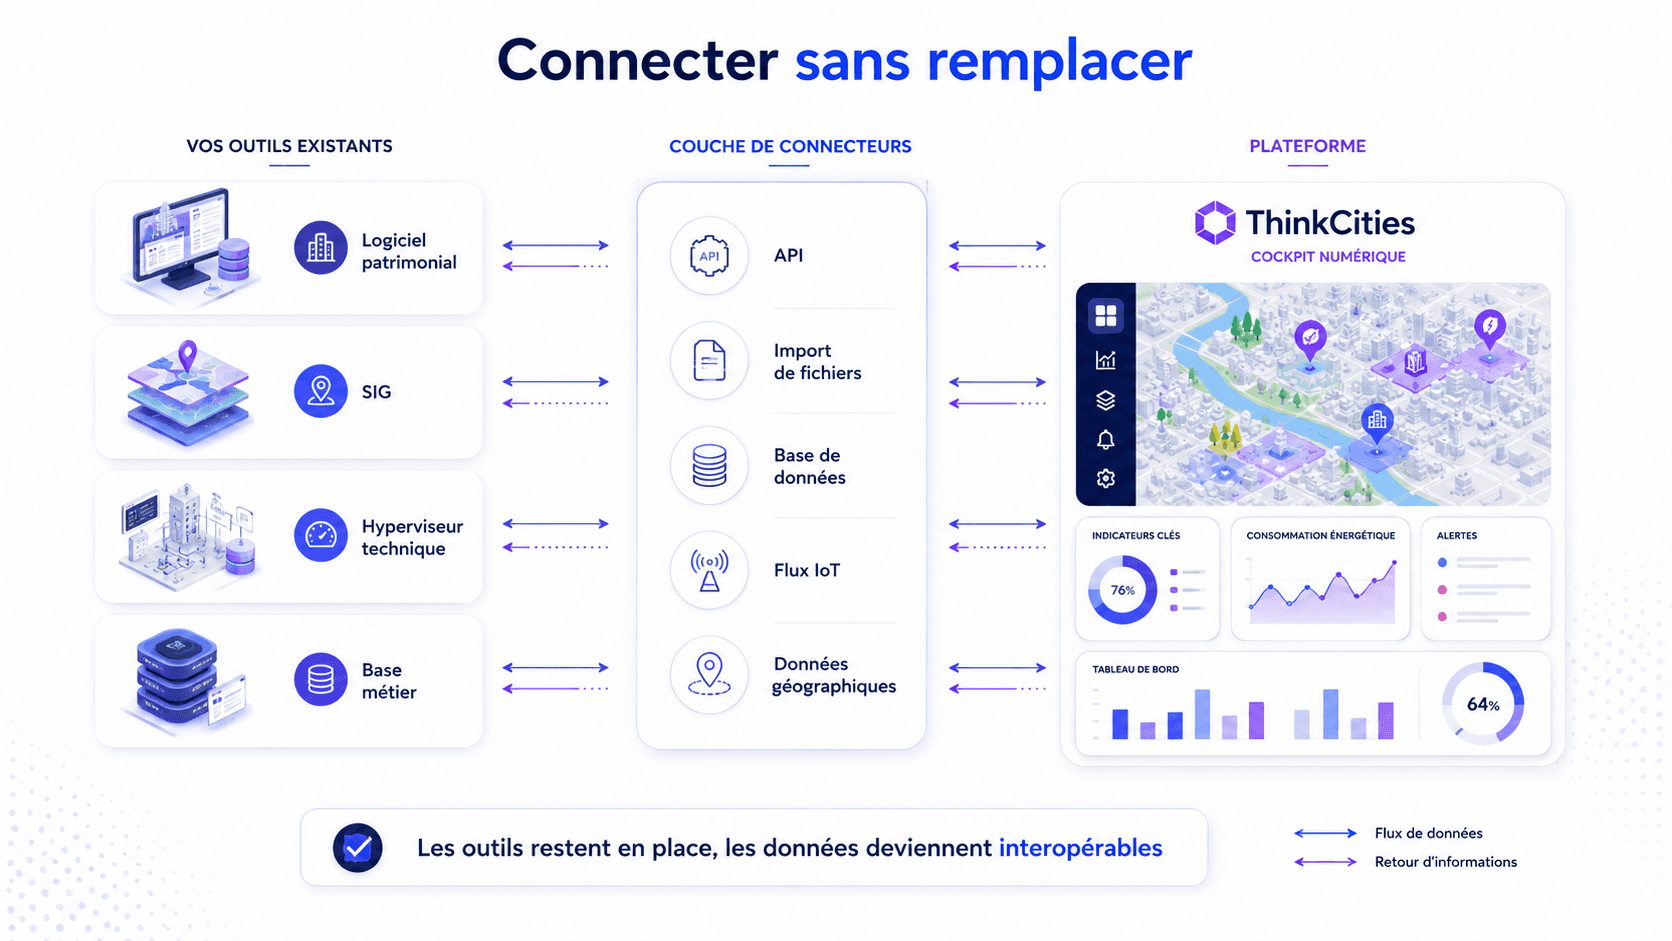
Retrieving information is only the first step.
Raw data can be:
incomplete;
recorded in an incompatible format;
associated with an incorrect unit;
duplicated;
obsolete;
poorly geolocated;
attached to the wrong building;
stemming from an ill-defined period or perimeter.
The same building can also have several names depending on the tools. Meters may not be associated with the correct area. Monthly data can be mistakenly matched with daily readings. Consumption can be expressed in different units.
Using this data directly in a dashboard can then produce misleading indicators.
Before any rendering, several processing steps are necessary.
1. Centralize
Useful data is gathered in a coherent environment, while maintaining the traceability of its source.
2. Harmonize
Formats, units, names, dates, and reference systems are standardized to make the information comparable.
3. Cross-reference
Different sources are cross-referenced to produce a more complete understanding of the situation.
For example, consumption data can be cross-referenced with the building concerned, its use, its surface area, its occupancy rate, or recently completed works.
4. Ensure reliability
Checks make it possible to detect anomalous values, duplicates, series breaks, or inconsistent information.
5. Structure
Data is organized according to user needs in order to feed maps, indicators, dashboards, alerts, or scenarios.
For geographical data, interoperability is a major challenge. The European INSPIRE directive notably aims to facilitate the sharing and combination of geographical information useful for environmental policies.
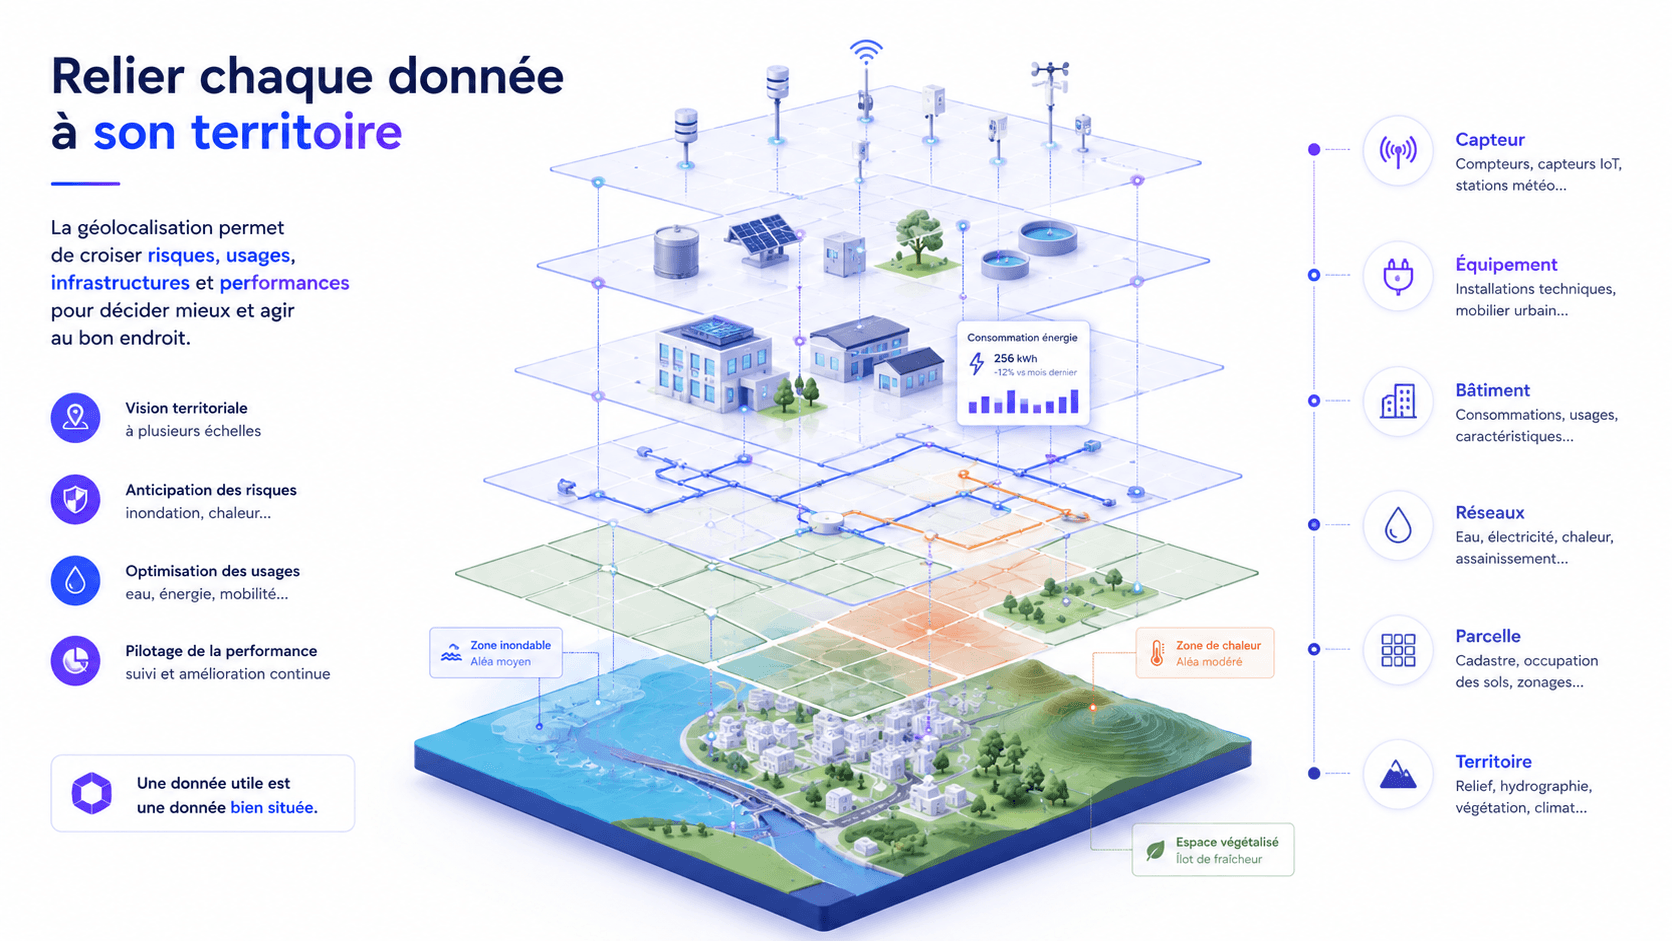
Why is the geographical dimension essential?
Environmental data often makes more sense when it is localized.
Energy consumption must be linked to a building or equipment. A water leak must be locatable on a network. A flood risk must be cross-referenced with the location of constructions and sensitive equipment.
Similarly, analyzing a heat island may require bringing together:
surface temperatures;
vegetation;
soil sealing;
materials;
building orientation;
building density;
the presence of water or shade.
The geographical dimension thus makes it possible to link several scales:
territory → site → parcel → building → equipment → meter or sensor.
This spatial structuring facilitates data understanding, comparison of areas, and the identification of action priorities.
It also constitutes one of the cornerstones of interactive maps and territorial digital twins. The ability to integrate, synchronize, and analyze several data sources directly contributes to the increasing maturity of a digital twin.
Collect less, but collect better
The multiplication of sensors and digital tools might suggest that the quality of management depends mainly on the volume of data available.
This is not always the case.
Excessive collection can increase costs, multiply useless streams, complicate storage, and make dashboards harder to interpret.
Instead, an effective strategy consists of:
linking each piece of data to an identified use;
leveraging existing sources before creating new ones;
choosing a level of precision tailored to the decision;
defining a relevant update frequency;
documenting the origin and the person responsible for the data;
regularly organizing quality controls;
deleting or archiving information that is no longer useful.
When the collection involves personal data, the principle of minimization must also be applied. The CNIL recalls that this data must be adequate, relevant, and limited to what is necessary in relation to the purposes of the processing.
The best data is therefore not necessarily the most detailed or the most frequently updated. It is the one that meets a specific need and enables action.
From raw data to operational management by use case, by objective, by challenge to serve a goal, a strategy, and a vision.
Once collected, connected, and reliable, data can feed into various decision-making support tools. Crossing and putting them into perspective allows for the animation of all this information, revealing what was previously invisible, and enlightening decisions to serve a decarbonization strategy.
interactive maps;
dashboards;
performance indicators;
alerts;
digital twins;
simulations;
scenario comparisons;
action plans;
environmental or regulatory reports.
An organization can thus compare its sites, identify a consumption drift, visualize a vulnerable zone, monitor the implementation of its actions, or measure the effects of a development.
In the field of energy, bringing together consumption, heritage characteristics, and works carried out also helps to structure renovation trajectories. This approach is notably presented in our article dedicated to OPERAT and the financing of the energy renovation of public buildings.
Collection is therefore never an end in itself. It must make it possible to transition:
from technical data to business information, from business information to understanding, and then from understanding to action.
This is precisely the role of the digital twin when it transforms data into decisions.
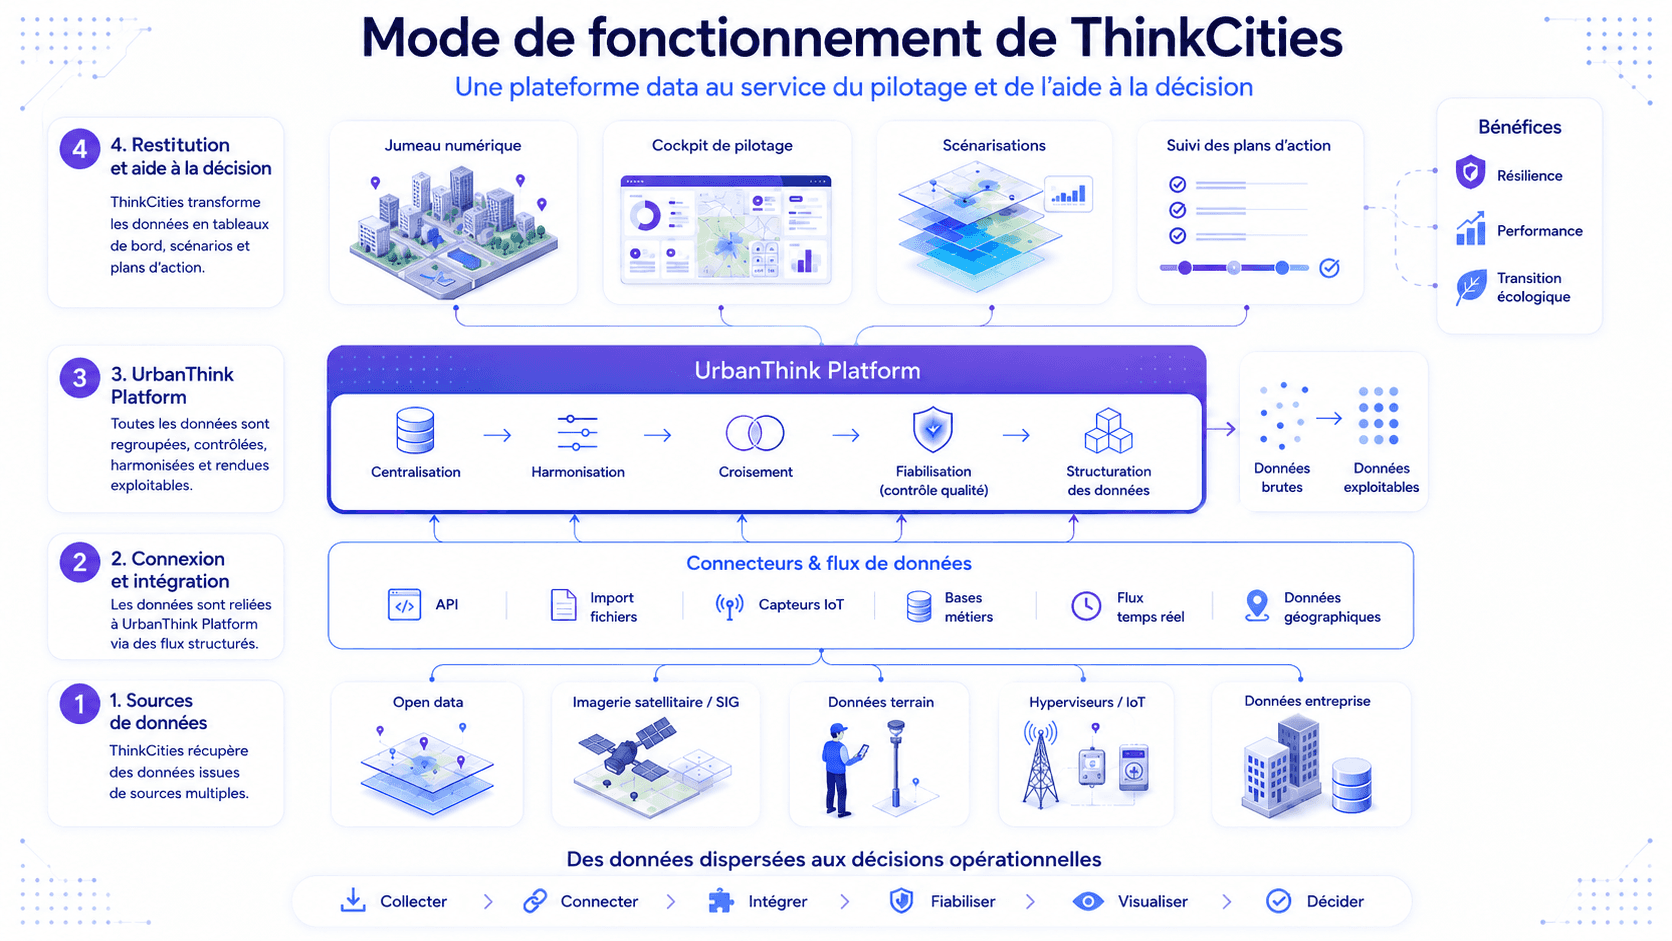
ThinkCities: a data chain at the service of decision-making
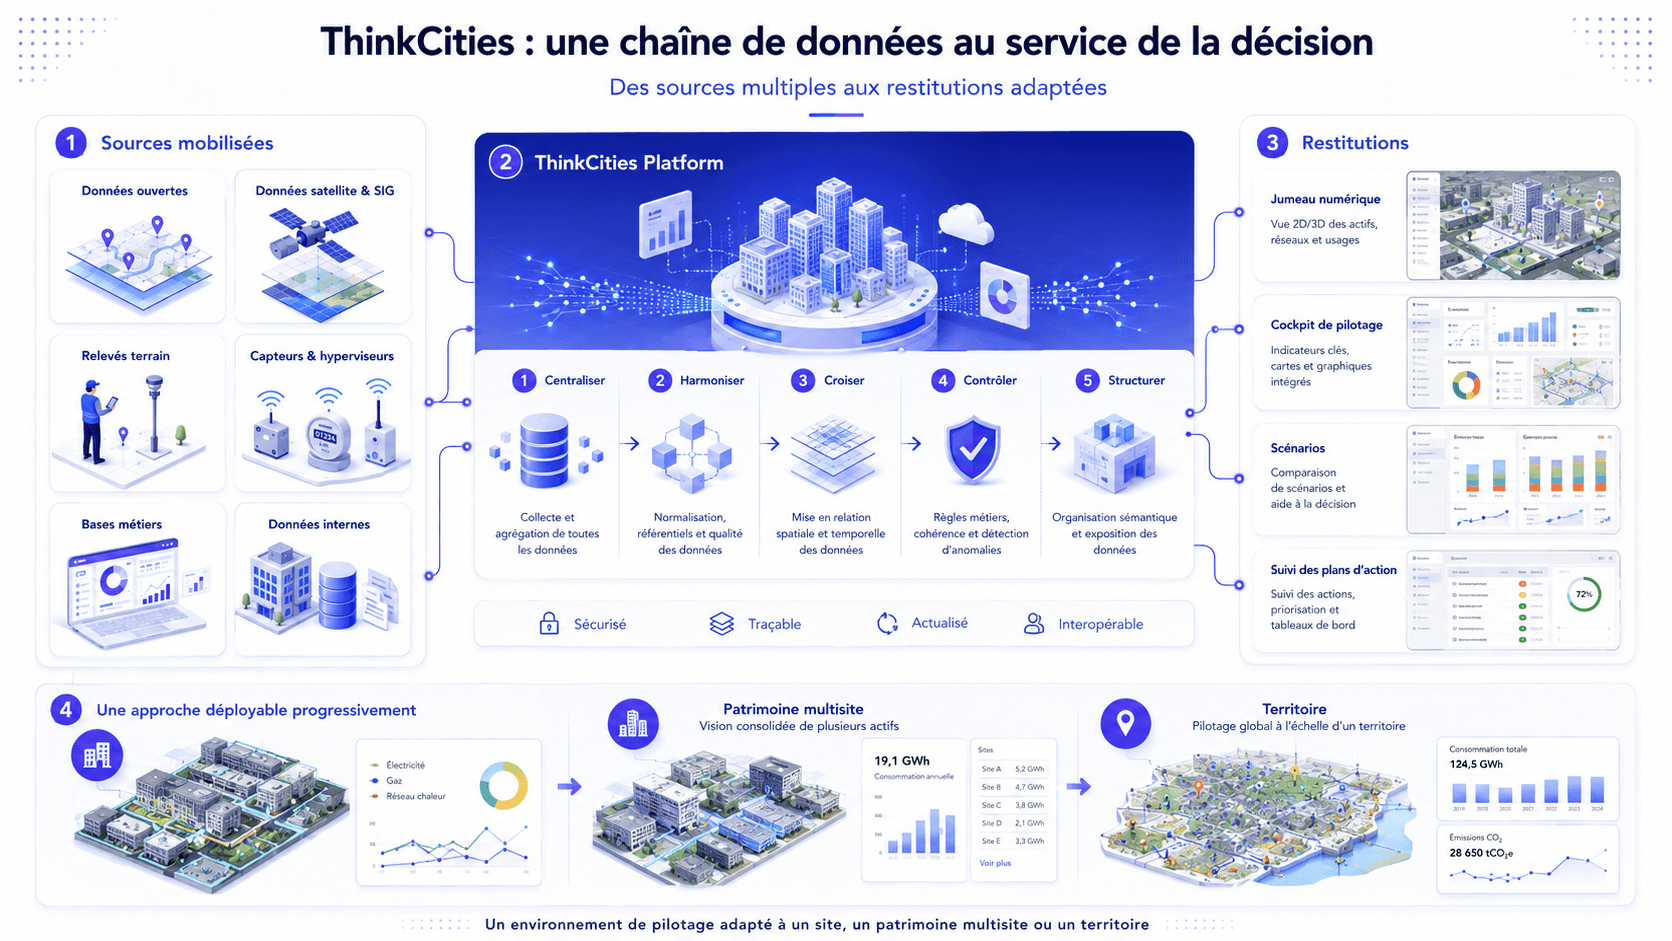
ThinkCities makes it possible to connect data from multiple sources and present it in a view tailored to the needs of each user.
Specifically, the platform can leverage:
open data;
satellite and geographical data;
field surveys;
sensors and hypervisors;
business databases;
internal data of the organization.
UrbanThink Platform then steps in to centralize, harmonize, cross-reference, control, and structure them.
The information can be delivered through:
a digital twin;
a management cockpit;
scenarios;
dashboards;
monitoring of action plans.
This process can be deployed progressively. A project can start with a few files and public databases, then integrate new sources, sensors, or automated flows as needs evolve.
It allows for building a management environment suitable for a single site, a multi-site heritage, or a territory.
Conclusion: making data a real tool for action
Local authorities, developers, asset managers, and companies already have much of the information needed to improve their environmental management.
But this data is still too often scattered among different software, departments, files, and partners.
Building an effective collection process consists of:
identifying priority questions, mobilizing the right sources, connecting existing tools, controlling the quality of information, and structuring it according to expected uses.
With ThinkCities, UrbanThink transforms this data into maps, dashboards, scenarios, and action plans. They then become real tools for knowledge, performance, and decision support.
Discover how this approach is applied in the field through UrbanThink achievements, in the areas of energy, water, biodiversity, mobility, and climate resilience.
Would you like to make better use of the data already available within your organization? Let’s discuss your sources, your tools, and your management objectives.