Jun 29, 2026
Biotope coefficient: how to promote biodiversity and reduce heat islands?

Urban densification, soil sealing, and the reduction of natural areas weaken biodiversity while intensifying the effects of high temperatures.
To better integrate nature into urban projects, some local authorities use the biotope area factor. This indicator makes it possible to assess the proportion of a plot dedicated to vegetated, permeable surfaces, or those favorable to ecological functioning.
The objective is not solely to achieve a regulatory value. It is about understanding how open ground, trees, permeable soils, and building vegetation can be combined to sustainably improve the ecological and climatic quality of a site.
Why measure the place of nature in urban projects?
Urban projects must meet several objectives that are sometimes difficult to reconcile. They must accommodate buildings, roads, parking lots, and public spaces, while preserving sufficient space for vegetation, living soil, and natural rainwater management.
When the majority of a plot is occupied by concrete, asphalt, or buildings, the natural functions of the soil decrease.
Water infiltrates less easily, roots have smaller volumes of soil available, and ecological continuity becomes harder to maintain. Mineral surfaces also absorb a significant portion of solar radiation and contribute to the rise in surface temperatures.
However, the presence of vegetated spaces alone does not guarantee the ecological quality of a project.
A lawn with low diversity, a thin green roof, and a wooded open ground area do not offer the same functions. They present neither the same capacity to host biodiversity, nor the same infiltration potential, nor the same effect on thermal comfort.
The biotope coefficient allows these differences to be taken into account by assigning a distinct value to the surfaces that make up the plot.
What is the biotope area factor?
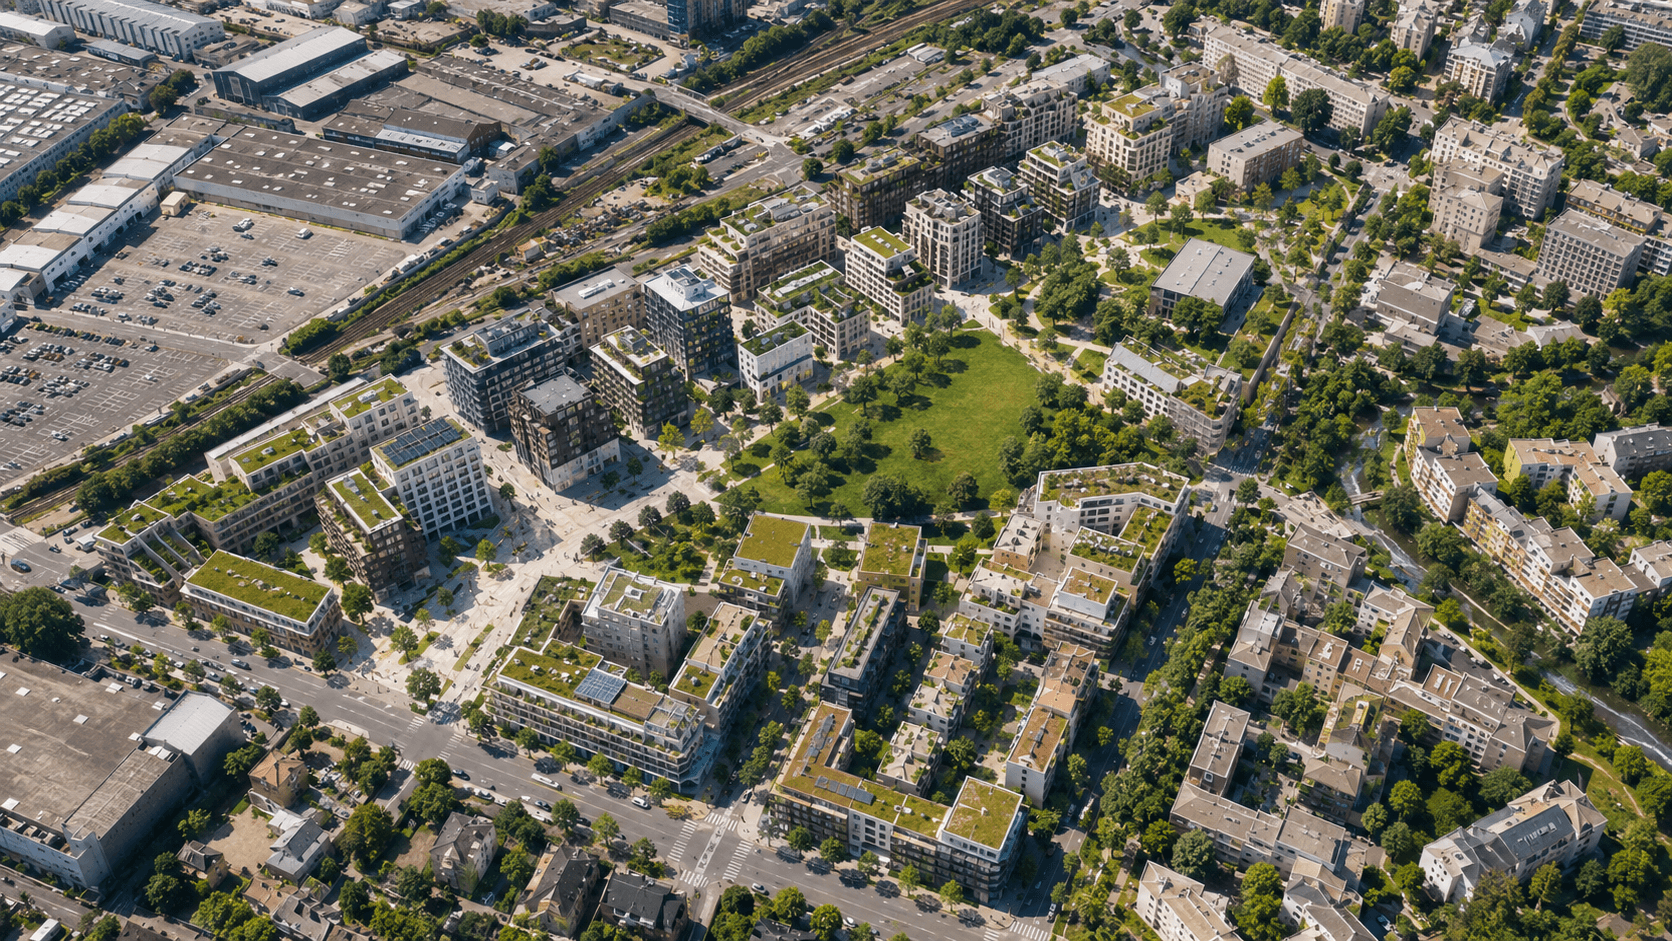
The biotope area factor, often referred to by the acronym BAF (or CBS in French), measures the proportion of surfaces on a plot considered favorable to nature.
It can include areas of open ground, permeable or semi-permeable soils, vegetated spaces on concrete slabs, green roofs, green facades, or certain systems designed for rainwater management.
Each category of surface receives a weighting coefficient based on its potential contribution to the ecological functioning of the site.
Open ground generally benefits from the highest value. It allows water to infiltrate, roots to develop, and organisms in the soil to sustain themselves.
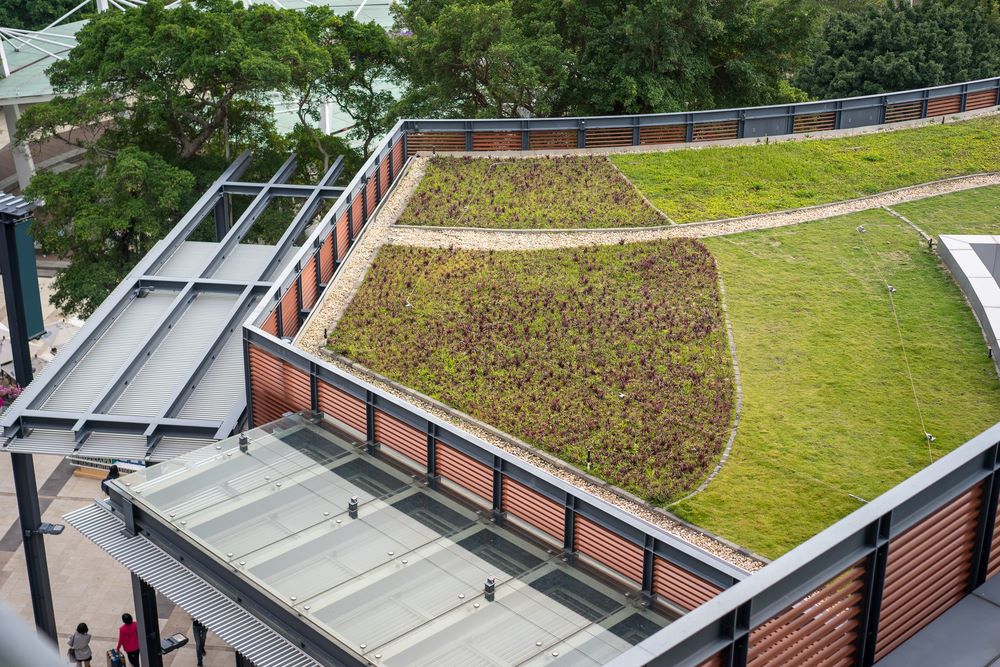
Vegetated surfaces installed on a concrete slab or roof can also be taken into account, but often with a lower weight. Their functioning indeed remains dependent on the depth of the substrate, access to water, and maintenance conditions.
Completely impermeable surfaces, such as buildings, concrete, or standard asphalt, generally do not contribute to the calculation.
The biotope coefficient thus corresponds to the ratio between the weighted eco-manageable area and the total area of the plot.
The categories selected, the coefficients applied, and the objectives to be respected can vary from one territory to another. They must therefore be defined according to the local context and the provisions laid out in the urban planning documents.
How is the biotope coefficient calculated?
The calculation is primarily based on a precise identification of land use.
Each space on the plot must be classified according to its nature: open ground, planted area on a slab, permeable pavement, green roof, building, or completely artificialized surface.
The surface area of each category is then multiplied by its associated coefficient.
Let's take the example of a 1,000 m² plot comprising 300 m² of open ground, 200 m² of semi-permeable pavement, 100 m² of green roof, and 400 m² of completely impermeable surfaces.
By applying a coefficient of 1 to the open ground, 0.5 to the semi-permeable pavement, 0.7 to the green roof, and 0 to the impermeable surfaces, the weighted eco-manageable area reaches 470 m².
The biotope coefficient of the plot is then equal to 0.47.
This value allows for the comparison of several projects or several development options. However, it is not sufficient on its own to describe precisely the ecological quality of the spaces created.
Two plots can obtain the same coefficient with very different configurations. One may preserve a large area of wooded open ground, while the other distributes favorable surfaces among several small green roofs and permeable pavements.
The mathematical result may be identical, but the effects on biodiversity, water infiltration, and thermal comfort will not necessarily be comparable.
How does the biotope coefficient promote biodiversity?
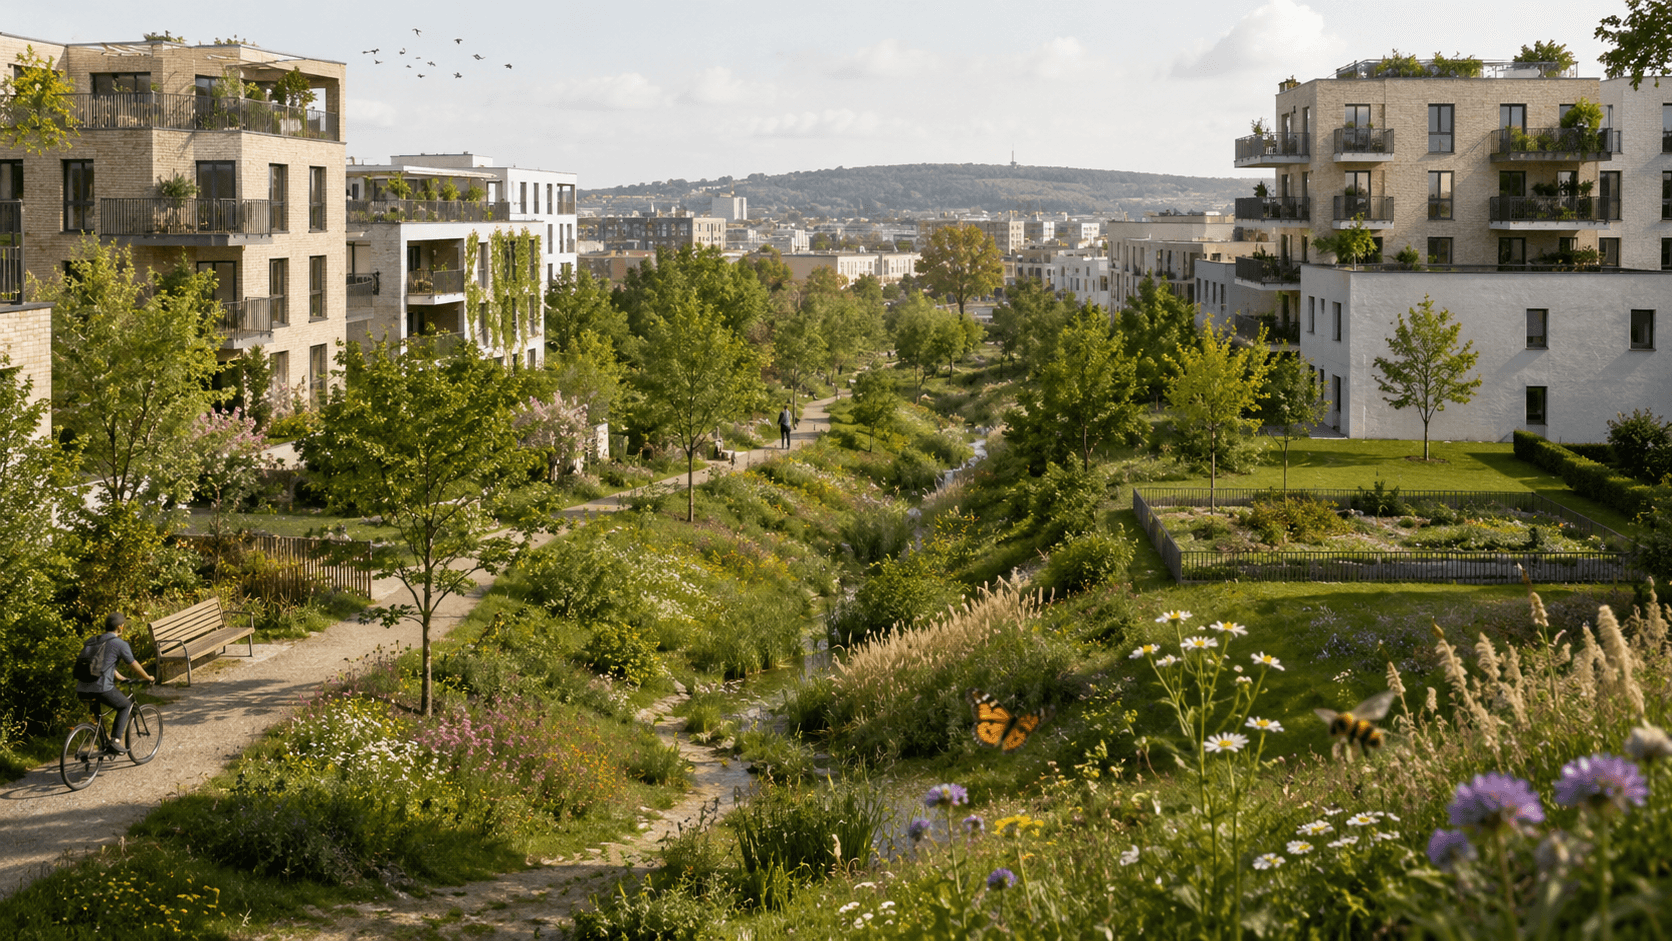
The biotope coefficient does not directly measure the presence of animal or plant species. Rather, it helps to preserve or create surfaces capable of hosting living organisms.
By encouraging the preservation of open ground, it first of all contributes to protecting the soil.
Living soils perform many functions. They enable root development, participate in the water cycle, store carbon, and host a wide diversity of microorganisms, insects, and small animals.
The coefficient can also encourage the creation of new habitats through the planting of trees, shrubs, hedges, or herbaceous layers.
The quality of these habitats, however, depends on the choices made. The diversity of species, their adaptation to local conditions, the presence of several vegetation layers, and maintenance methods directly influence a space's capacity to host biodiversity.
A vegetated surface composed of a single species and regularly mown does not provide the same benefits as a space combining trees, shrubs, perennial plants, and areas left to develop more naturally.
The distribution of spaces also plays an important role.
A vegetated space isolated in the middle of entirely artificialized surfaces can offer occasional refuge, but it contributes little to species movement. When linked to a park, a hedge, a watercourse, an alignment of trees, or another natural space, it can, however, participate in an ecological continuity.
The effectiveness of the biotope coefficient therefore depends as much on the quantity of favorable surfaces as on their quality, organization, and connection to the rest of the territory.
To go beyond the mere calculation of the biotope coefficient, it is necessary to monitor the quality of the habitats created, their evolution, and the ecosystem services they provide. This measurement approach allows planting, soil de-sealing, or renaturing actions to be transformed into genuine levers of environmental strategy.
We detail this approach in our article "Territories and businesses reconciled by biodiversity: how to transform local actions into measurable value".
What role does it play in reducing heat islands?
Heat islands appear mainly in areas where mineral surfaces are abundant, where vegetation is scarce, and where air circulation is limited.
During the day, asphalt, concrete, and certain roofs absorb a significant portion of solar energy. This heat is then gradually released, even after sunset.
Vegetation and permeable soils can limit this phenomenon in several ways.
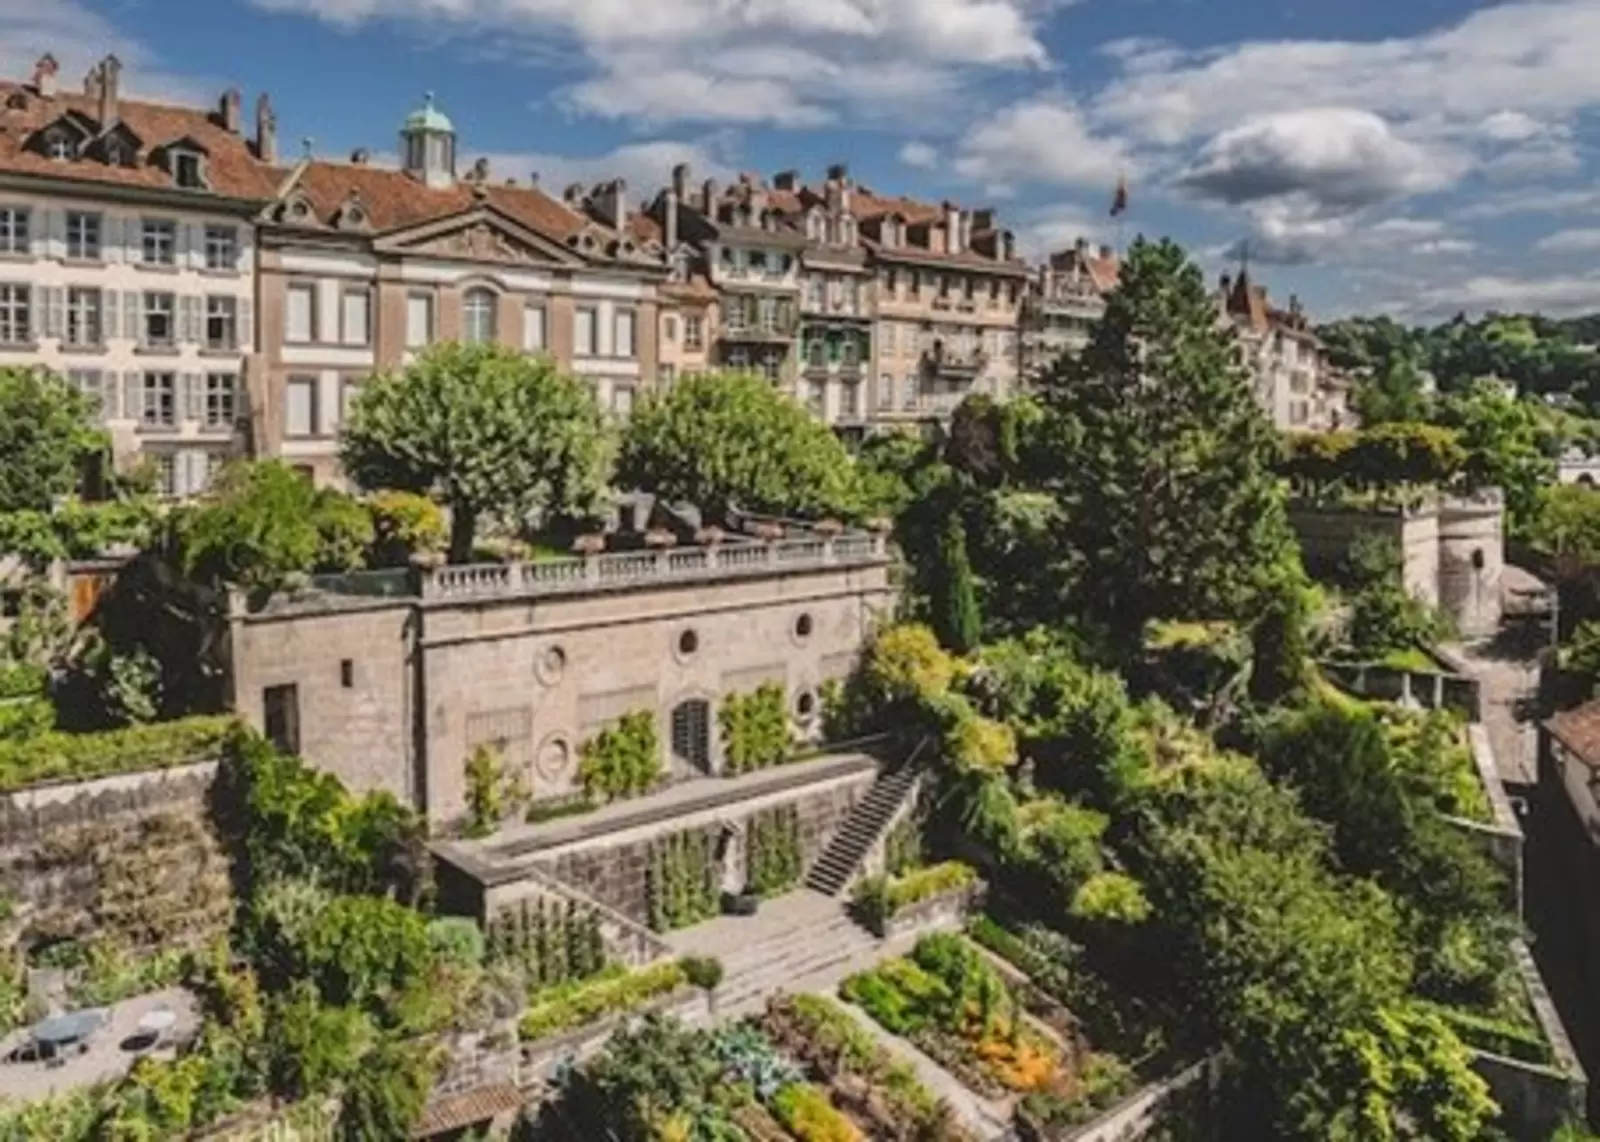
First of all, trees produce shade. They reduce the direct exposure of soils, facades, and users to solar radiation.
Their effectiveness depends on their size, placement, the density of their foliage, and the surface area covered by their canopy. An adult tree with sufficient soil volume therefore does not produce the same effects as a young tree recently planted in a restricted pit.
Vegetation also contributes to cooling through evapotranspiration. Plants draw water from the soil and release a portion of it into the atmosphere, which helps to locally lower the air temperature.
This mechanism, however, depends on water availability. Vegetation subjected to severe water stress loses part of its cooling capacity.
The preservation of permeable soils and the infiltration of rainwater are therefore closely linked to the effectiveness of revegetation.
Finally, replacing a portion of dark and impermeable surfaces with planted soils or more suitable pavements reduces the amount of heat stored during the day.
The biotope coefficient can thus contribute to the reduction of heat islands, provided that the vegetated surfaces are correctly designed and positioned.
Why does a high coefficient not guarantee a high-performance project?
The biotope coefficient provides summarized information, but it does not describe the overall ecological and climatic functioning of a site.
A project can achieve the required coefficient thanks to vegetated surfaces distributed on roofs, without retaining enough open ground to allow the development of large trees.
Conversely, another project may favor a continuous space of open ground, connected to neighboring natural spaces and capable of hosting several vegetation layers.
The two projects will not produce the same results, even if their final coefficient is close.
The location of the developments is also decisive. A tree placed to the south of a building, along a pedestrian path, or near a highly frequented area can have a direct effect on user comfort.
The same planting installed in an already shaded or little-used sector will produce a different benefit.
The maturity of the vegetation must also be taken into account. Newly planted trees do not immediately provide all the expected shade. Their effects increase progressively with their growth, provided that soils, available water, and maintenance practices allow their development.
The project's timeline and that of the ecological benefits are therefore not always the same.
The biotope coefficient should thus be considered as an orientation and comparison tool, rather than an exhaustive measure of environmental performance.
Moving from a regulatory goal to a renaturing strategy
To become a real decision-making tool, the biotope coefficient must be cross-referenced with other information.
The share of open ground, soil sealing rate, canopy cover, surface temperatures, shaded areas, ecological continuities, and soil infiltration capacity provide a more comprehensive reading of the territory.
This approach requires considering the soil as a living infrastructure, capable of infiltrating and storing water, cooling urban spaces, and hosting biodiversity.
As we explain in our article published on Construction21, "Digital technology serving soil, water and living organisms", cross-referencing territorial data makes it possible to go beyond a thematic reading to better understand the global functioning of a site and guide renaturing actions.
In particular, this data helps determine the most mineralized sectors, areas where existing vegetation must be protected, and plots presenting the highest renaturing potential.
They also allow for the study of the combined effects of several solutions.
The de-sealing of a parking lot can be combined with tree planting, the creation of bioswales, and the use of more permeable paving. The project then acts simultaneously on water infiltration, shade, biodiversity, and surface temperatures.
The analysis must also be conducted at several scales.
At the plot scale, it allows for checking the distribution between built, mineral, and vegetated surfaces. At the neighborhood scale, it helps identify possible continuities between different natural spaces. At the territory scale, it contributes to building a coherent strategy of green and blue infrastructure.
The challenge is therefore not only to increase the quantity of vegetation, but to create a network of functional natural spaces adapted to local constraints.

Mapping the biotope area factor to identify priority areas
The calculation of the biotope area factor is often carried out at the scale of a real estate development or a plot of land.
Its cartographic representation makes it possible to go further by comparing situations at the scale of a neighborhood, an activity zone, or a territory.
Land cover data can be used to distinguish unsealed soil areas, buildings, roads, parking lots, vegetated areas, and different types of surfaces.
This mapping makes it possible to identify areas where the factor is low and to understand the reasons for this situation.
A sector may show a deficit due to a high built density, very extensive parking lots, a low presence of trees, or almost complete soil sealing.
The mapping thus transforms a global value into localized and actionable information.
It helps identify locations where de-paving, planting, or modifying surfaces could produce the most significant benefits.
It also facilitates dialogue between local authorities, developers, designers, and managers by providing a shared representation of the challenges.
Comparing scenarios before starting works
The value of modeling does not lie solely in analyzing the existing situation. It also allows for testing several transformation hypotheses.
A first scenario might prioritize the creation of a large unsealed soil area. A second might distribute plantings along walkways and parking spaces. A third might combine green roofs, bioswales, shade trees, and permeable surfaces.
Each scenario can modify the biotope area factor, but also the canopy cover, water infiltration capacity, and exposure to high temperatures.
The comparison makes it possible to move beyond a logic based solely on compliance with a threshold.
It helps determine which surface arrangement produces the most beneficial effects regarding site uses, technical constraints, costs, and environmental objectives.
Expected benefits can also evolve over time. A green roof can produce effects quickly, whereas shade provided by trees increases progressively as they grow.
Modeling thus allows for integrating the different timelines of the project and objectifying trade-offs before works begin.
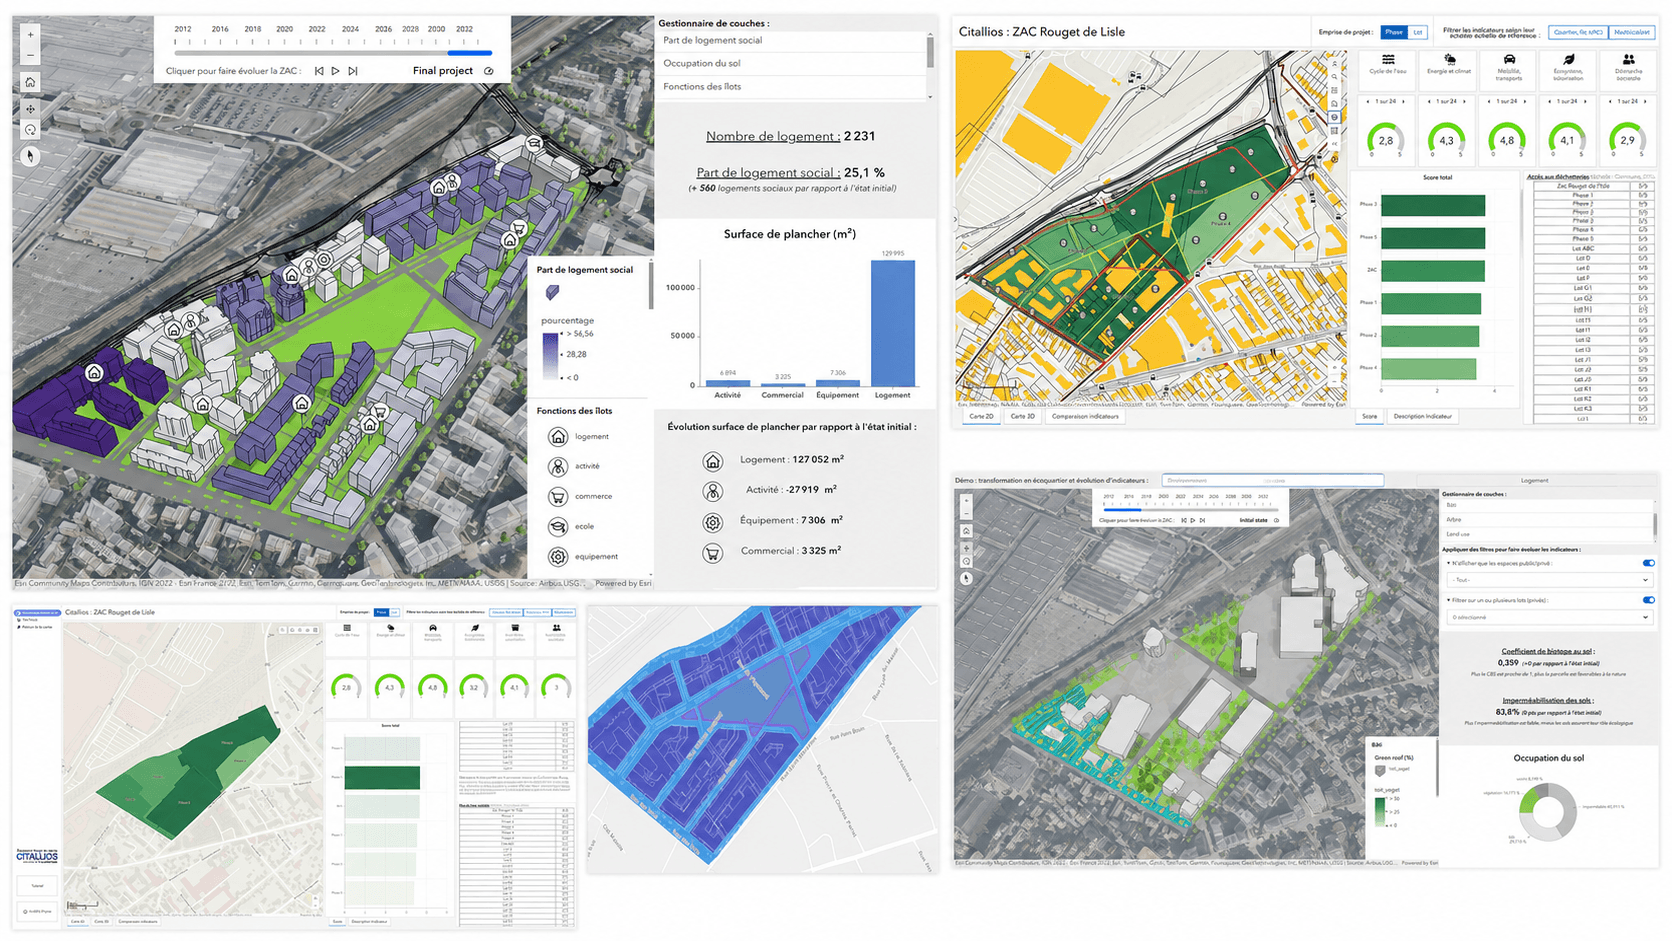
This approach was notably implemented for the ZAC Rouget de l’Isle in Poissy.
To assist Citallios in managing this 10-hectare operation, UrbanThink deployed a dedicated instance of ThinkCities®, enabling the centralization of urban and environmental data, tracking of indicators across phases and lots, and visualization of the project's progress.
The biotope area factor can thus be analyzed alongside other challenges related to the water cycle, climate, mobility, biodiversity, waste, and the neighborhood's social dimension.
How ThinkCities® helps evaluate renaturation projects
ThinkCities® brings together data on soils, buildings, vegetation, water, biodiversity, and climate conditions in a single platform.
Local authorities, developers, and site managers can visualize the distribution of sealed, permeable, and vegetated surfaces, and then calculate indicators at different scales.
The platform also allows for cross-referencing the biotope area factor with unsealed soils, tree canopy cover, ecological corridors, and surface temperatures.
It thus becomes possible to pinpoint the areas least favorable to biodiversity, identify zones exposed to heat islands, and target the spaces that require priority intervention.
Several development scenarios can then be integrated and compared.
Decision-makers can visualize the potential consequences of de-paving, new plantings, creating bioswales, or greening buildings.
The digital twin helps test choices before implementation and objectify trade-offs between impact, cost, and feasibility.
After construction, the same indicators can be tracked to measure the evolution of the site and progressively adjust the strategy.
The biotope area factor then becomes more than just a value to meet. Combined with mapping and modeling, it contributes to building a coherent, measurable renaturation strategy tailored to the characteristics of each territory.
In the face of biodiversity loss and intensifying high heat, the challenge is not just to plant more. It consists of preserving soils, planting in the right place, connecting natural spaces, and measuring the actual effects of development projects.
Do you want to map the biotope area factor of your territory and compare several renaturation scenarios? Discover how UrbanThink and ThinkCities® can support you.